What the Architecture Covers
Metrics
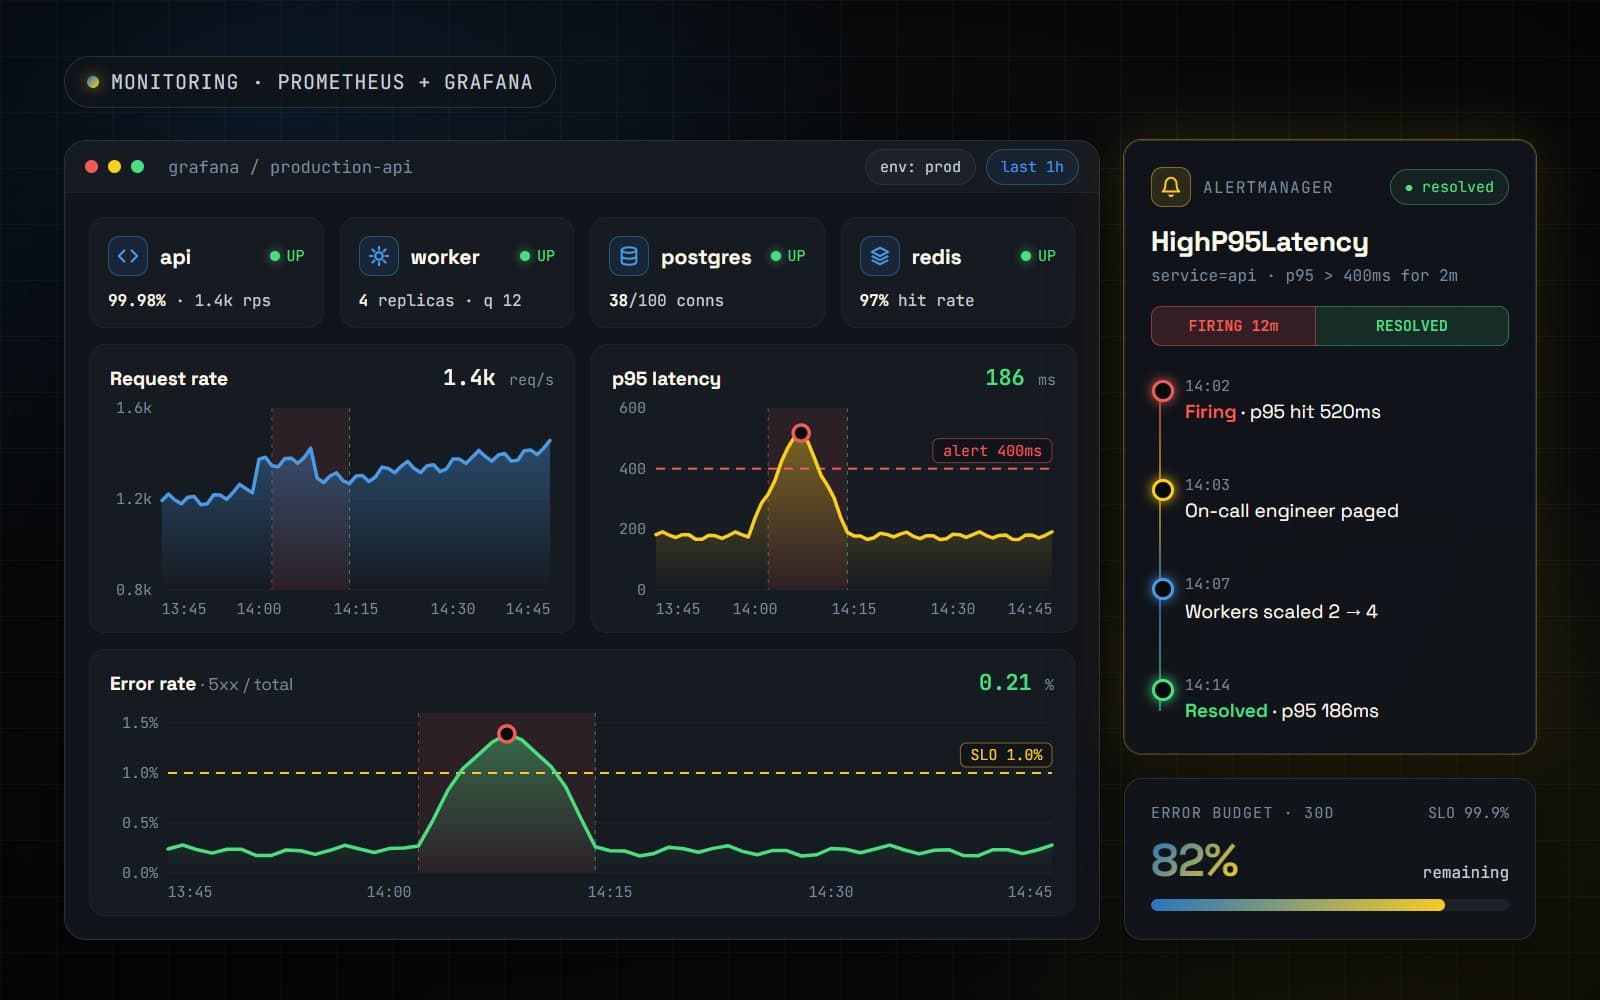
Request rate, p95 and p99 latency, error rate, queue depth and job duration exposed for Prometheus.
Dashboards
Grafana dashboards per service, so the health of the API, workers, database and cache is clear at a glance.
SLO-based alerting
Alerts on user-facing symptoms such as error budgets and latency, routed to Slack or email, not on noise.
Structured logs
JSON logs with request IDs that tie an alert to the exact failing requests.
Health checks
Liveness and readiness checks that let the platform restart or drain unhealthy containers automatically.
Incident follow-up
Every incident ends with a fix and a new alert or test, so it does not happen twice.
Tools & Stack
- Prometheus
- Grafana
- CloudWatch
- Structured logging
- FastAPI
- Docker
In Practice
Applied in the Mobileriz multi-marketplace backend: Prometheus monitoring watches the API, scheduled marketplace syncs and background jobs.
This blueprint is part of my Python backend & API development service. Tell me about your system on Upwork and I'll propose the right setup, timeline and cost.